Latest Blog Posts
Discover insights, tips, and guides for working with JSON data visualization tools

JSON Viewer Now on Android: Visualize, Edit & Share JSON on the Go
The wait is over! We are thrilled to announce that JSON Viewer is now officially available on the Google Play Store.
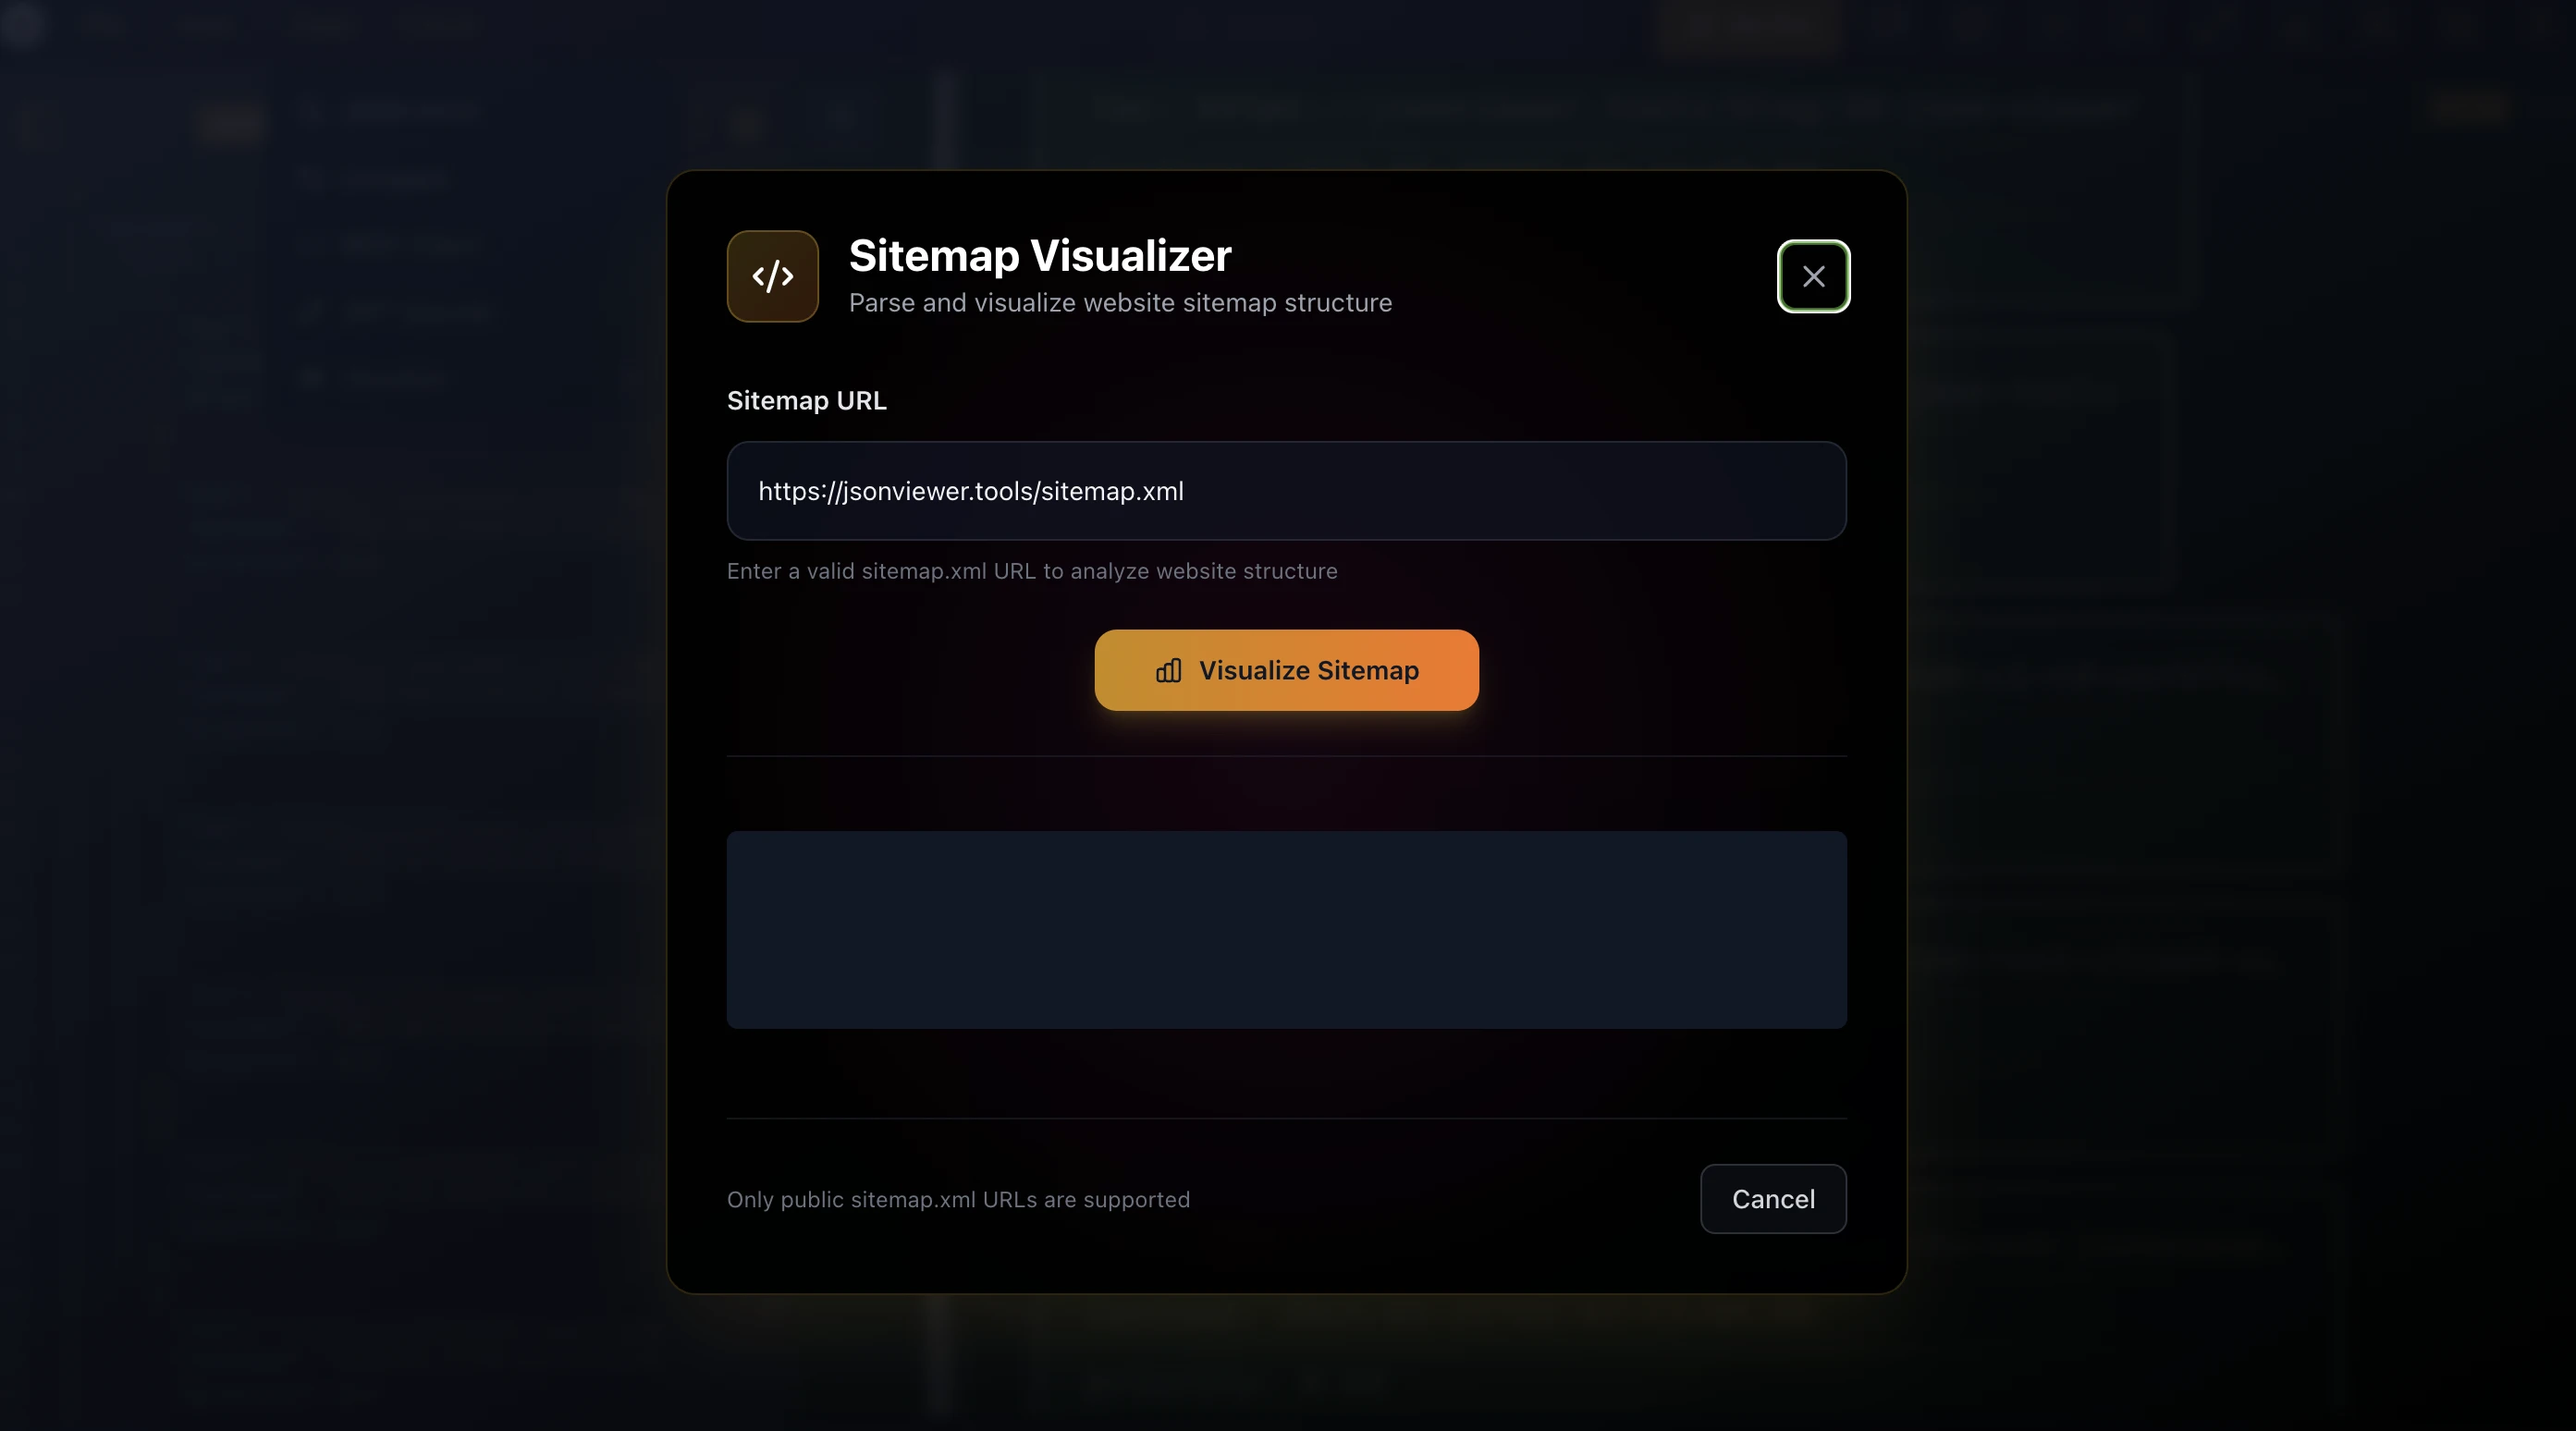
How to Visualize Website Structure from XML Sitemap
Turn raw XML sitemaps into interactive diagrams to explore your website’s structure, improve SEO, and simplify navigation analysis.
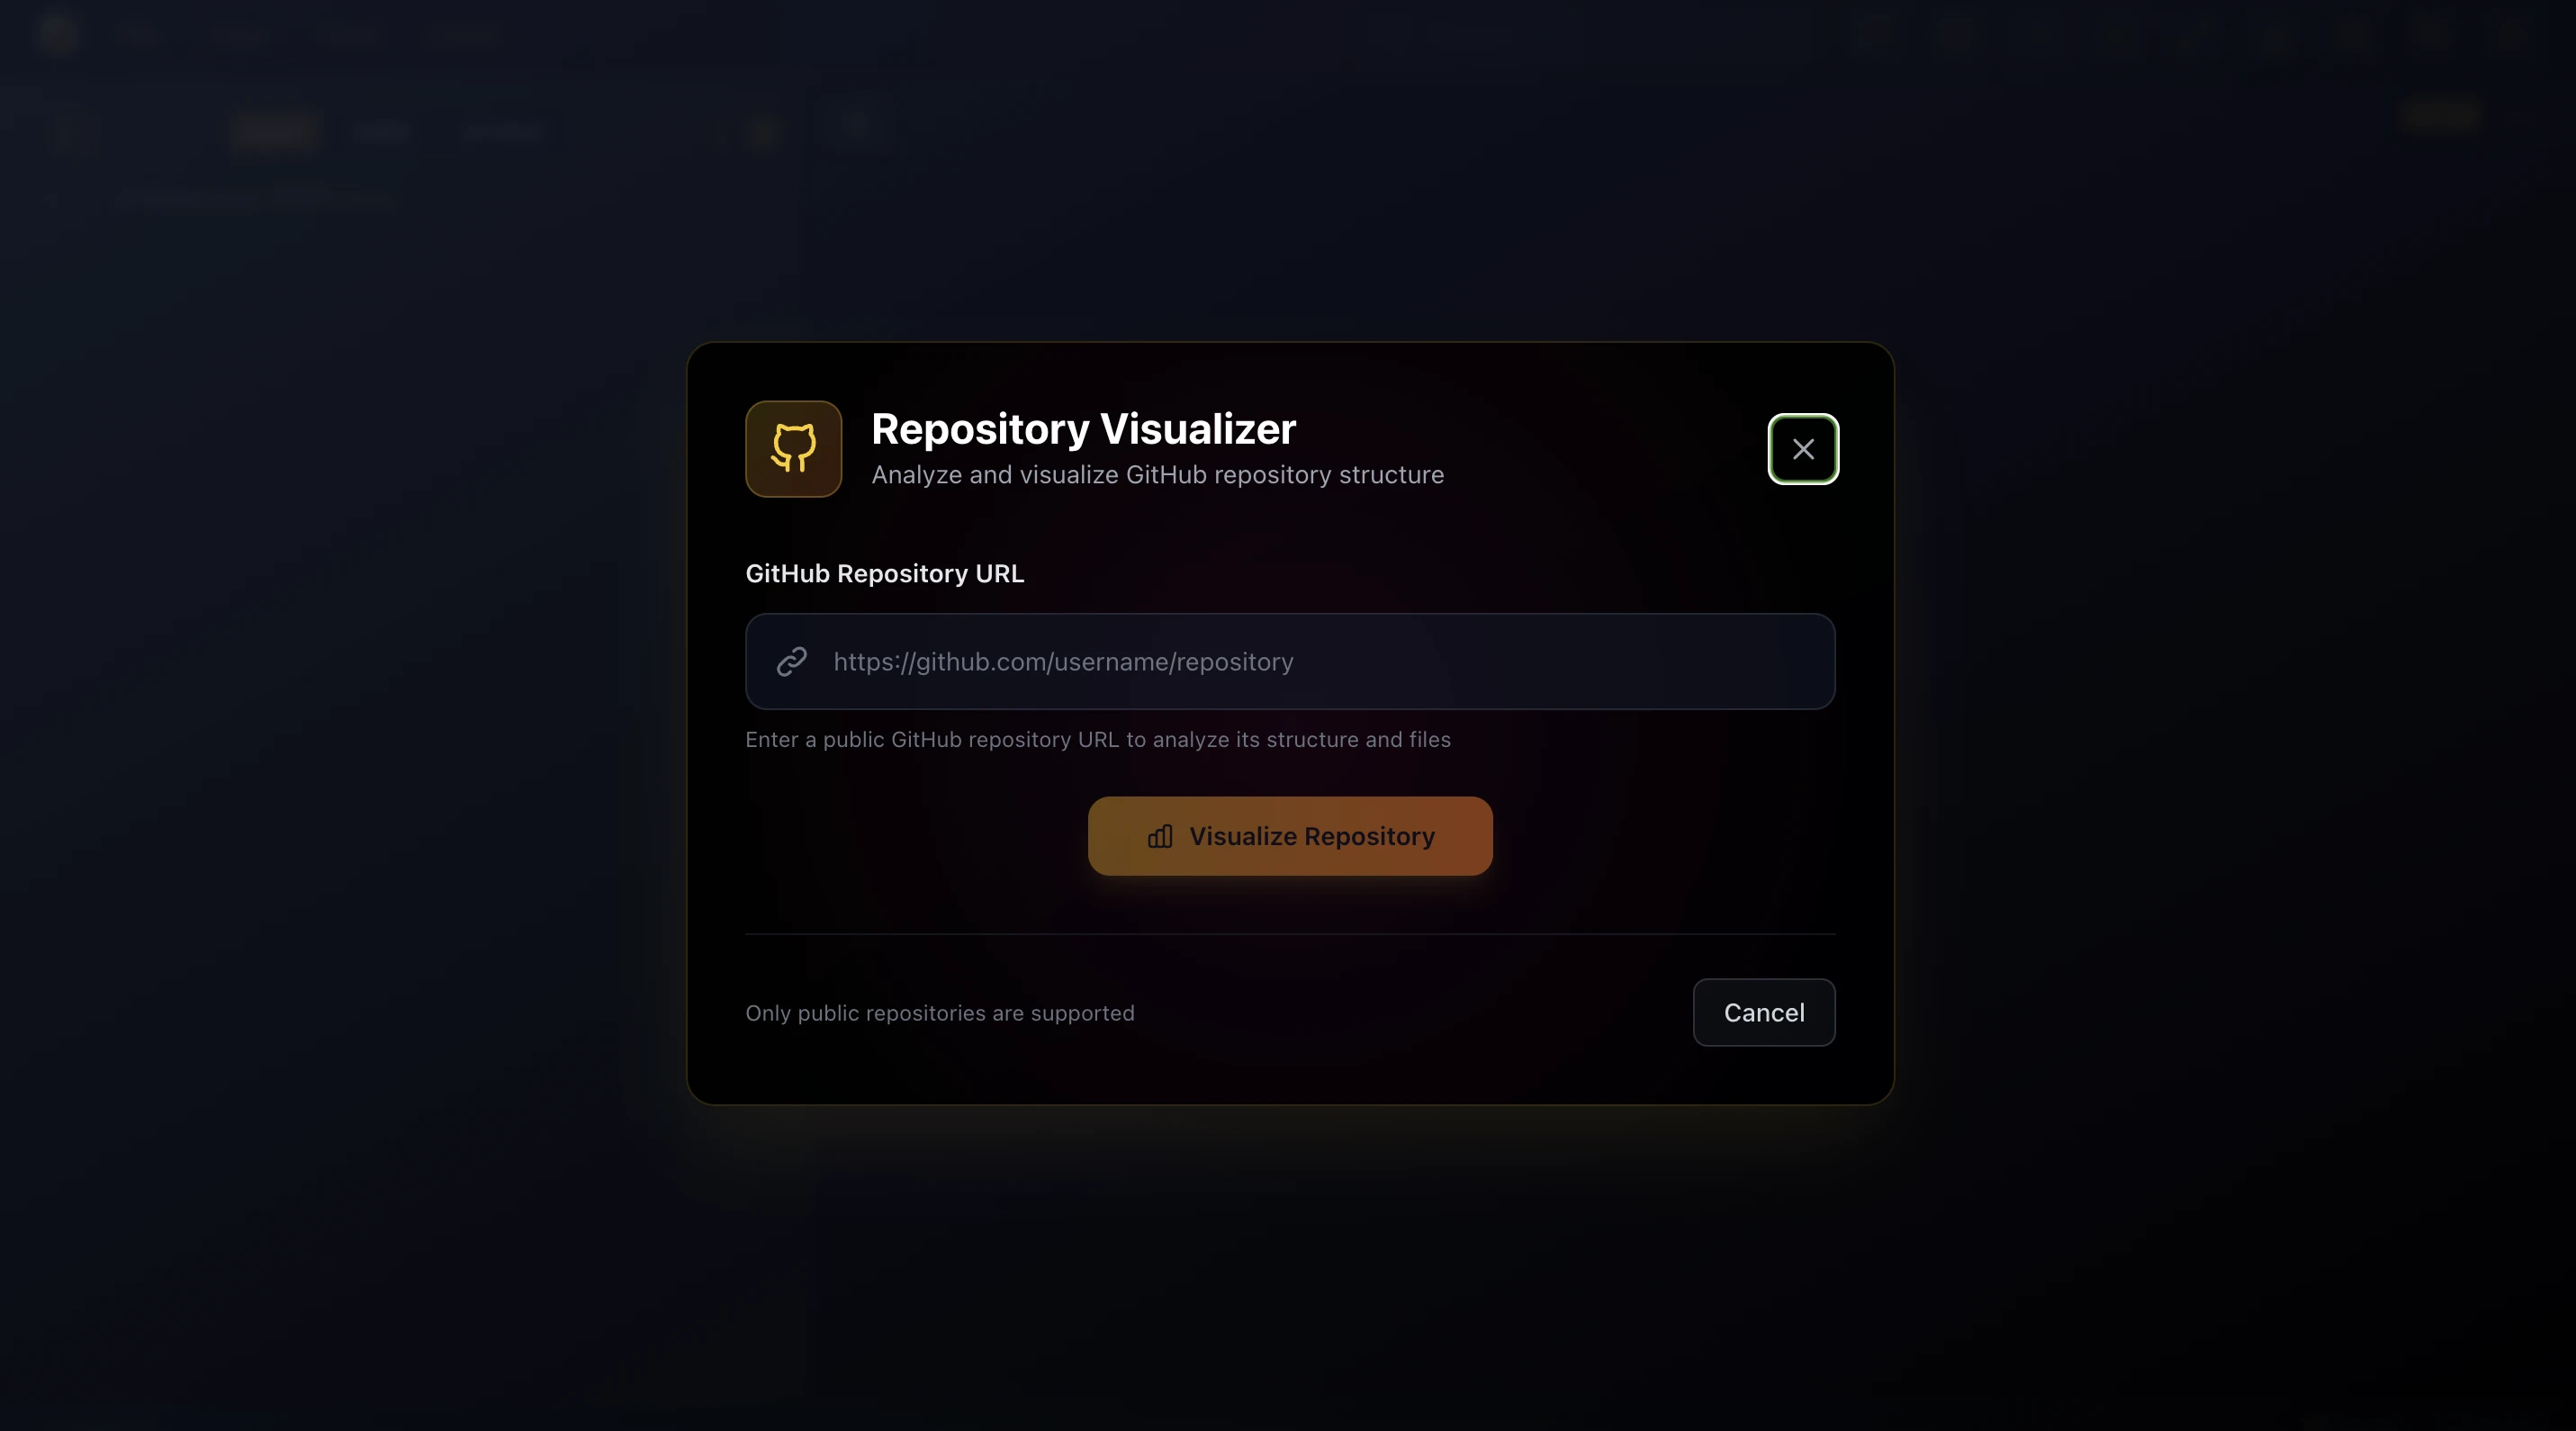
How to Visualize Github Repo
Visualizing your Github repository is a great way to understand the structure of your code and the relationships between files.
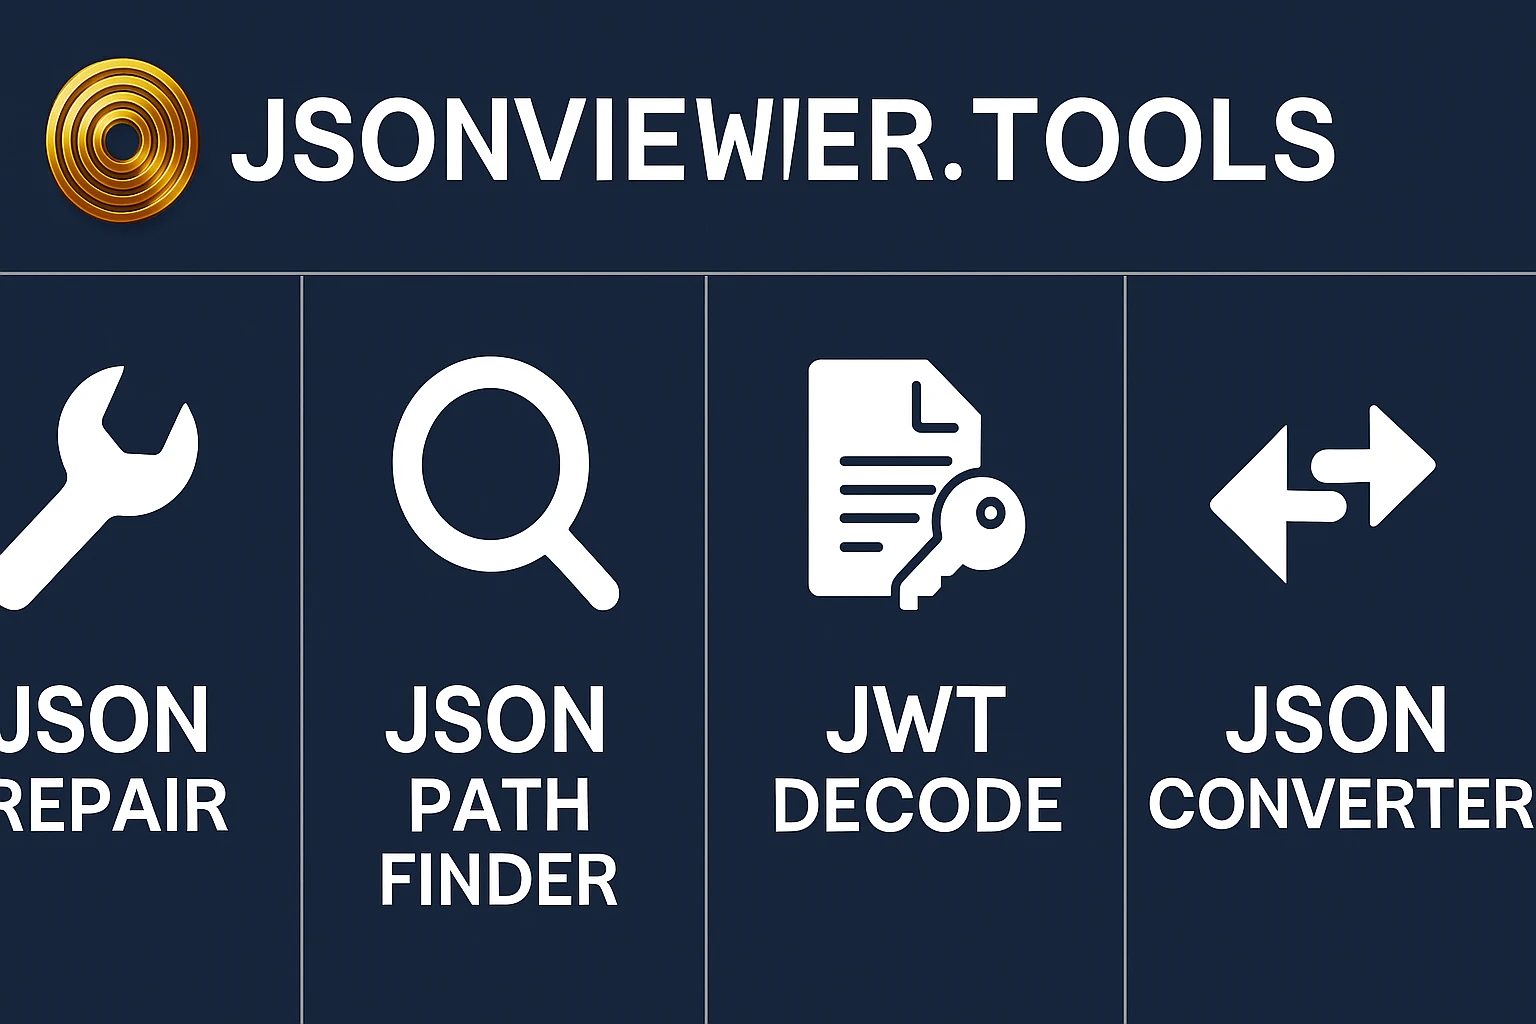
All-in-One Online JSON Tool: Repair, Convert to YAML/CSV/TOML & Decode JWT
Easily repair broken JSON, extract JSONPath, decode JWT tokens, and convert JSON to YAML, CSV, TOML—all in one free online tool: jsonviewer.tools.
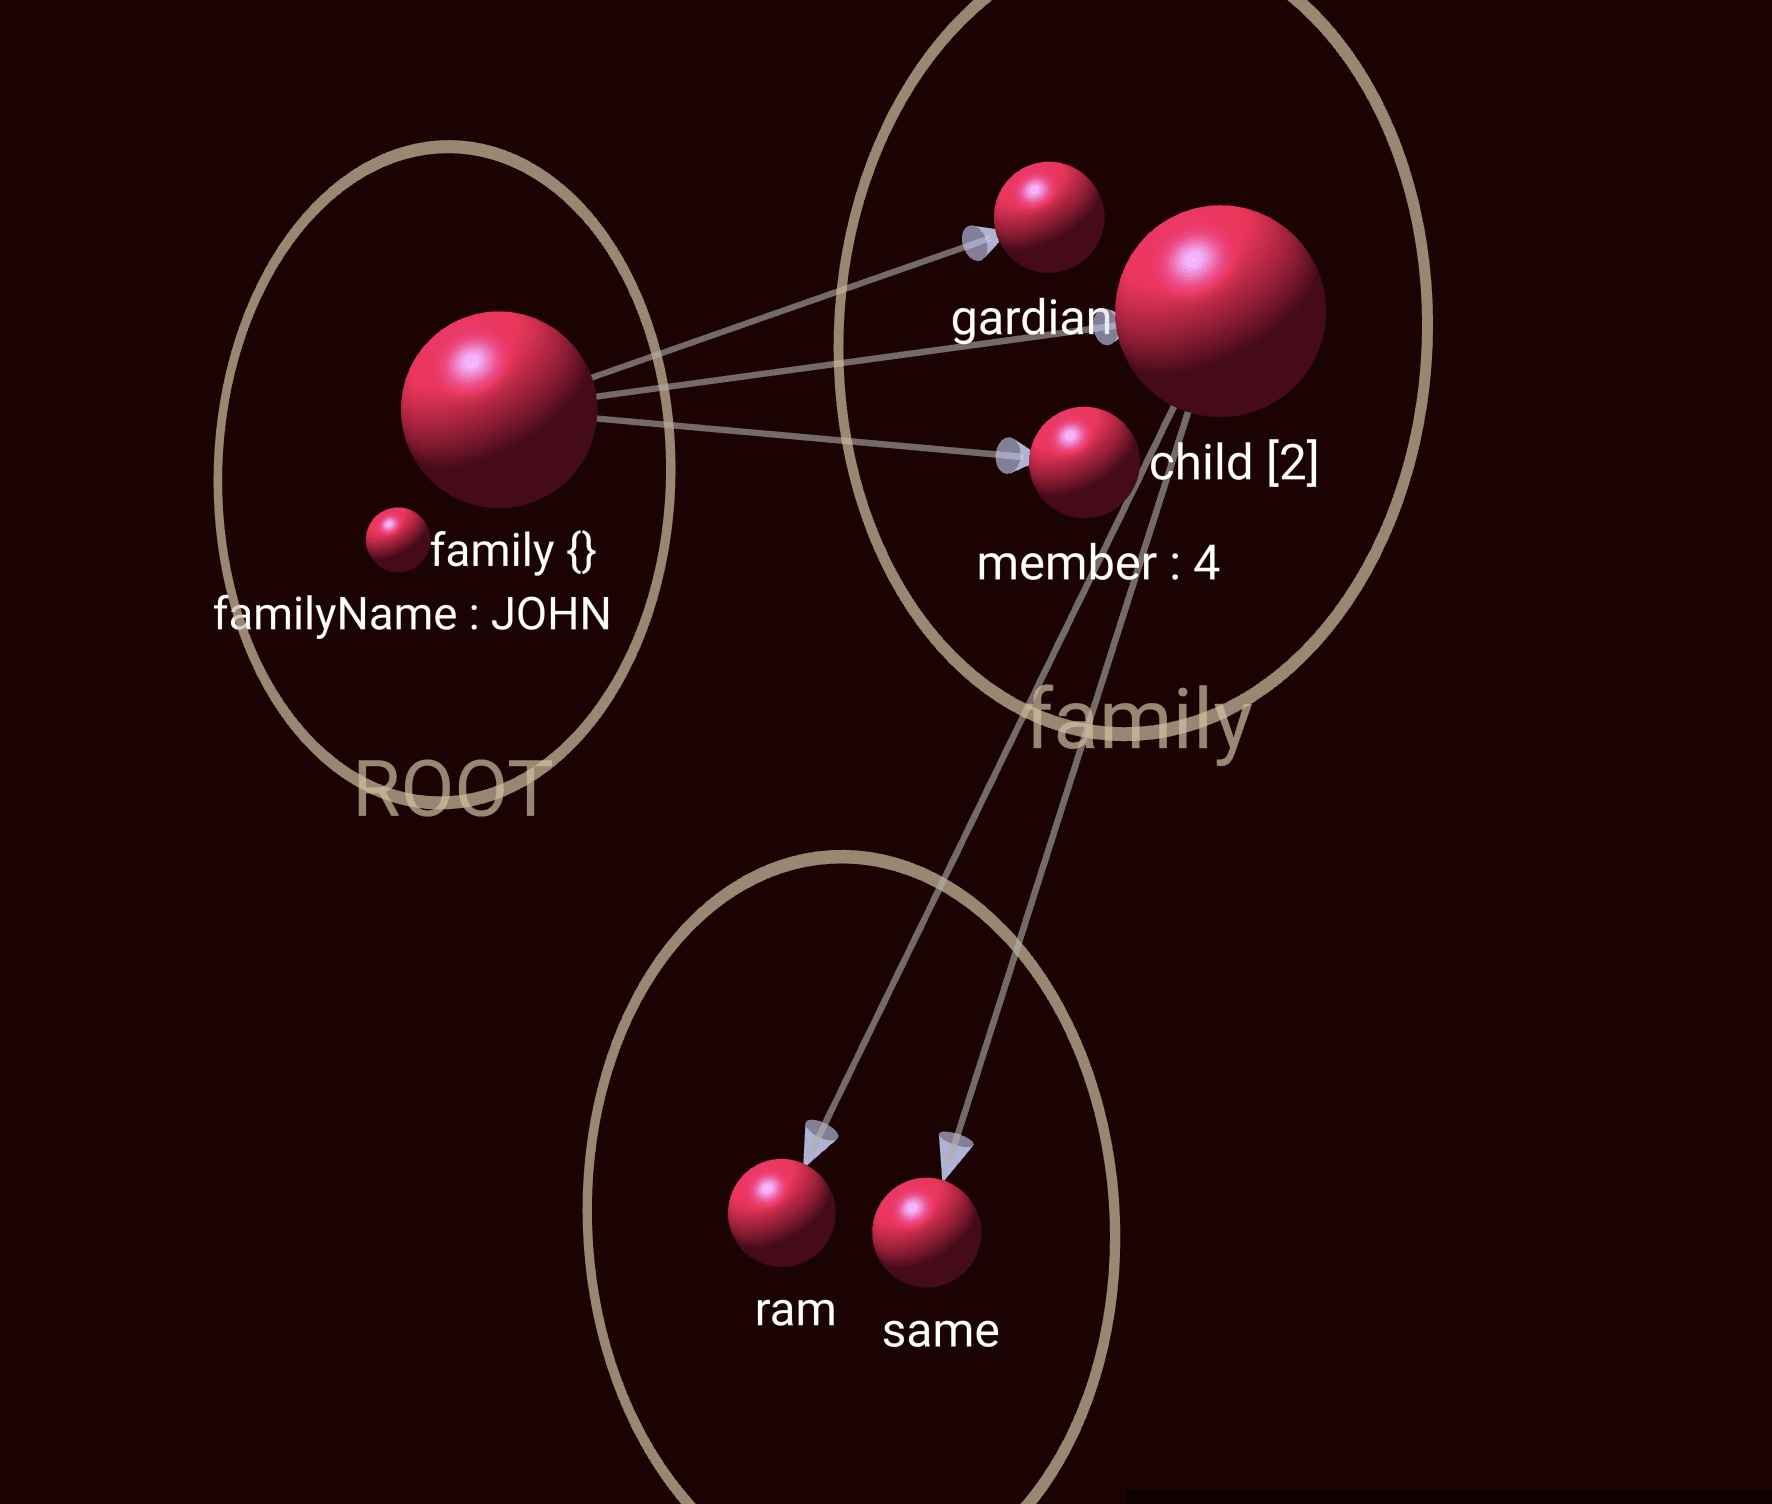
Dive into Data Like Never Before: Introducing JSON 3D Visualization
At jsonviewer.tools, we’re thrilled to unveil our newest innovation—3D JSON Visualization. This isn’t just a new way to look at data—it’s a whole new dimension.

Unlock the Power of AI with JSON Viewer Tools
At jsonviewer.tools, we're pushing the boundaries of what's possible with JSON data. Whether you're a developer, analyst, or curious learner