Dive into Data Like Never Before: Introducing JSON 3D Visualization
Welcome to the future of JSON exploration! At jsonviewer.tools, we’re thrilled to unveil our newest innovation—3D JSON Visualization. This isn’t just a new way to look at data—it’s a whole new dimension. Say goodbye to boring text blobs and static trees. Say hello to immersive, interactive, and mind-blowingly cool 3D diagrams
What is JSON 3D Visualization?
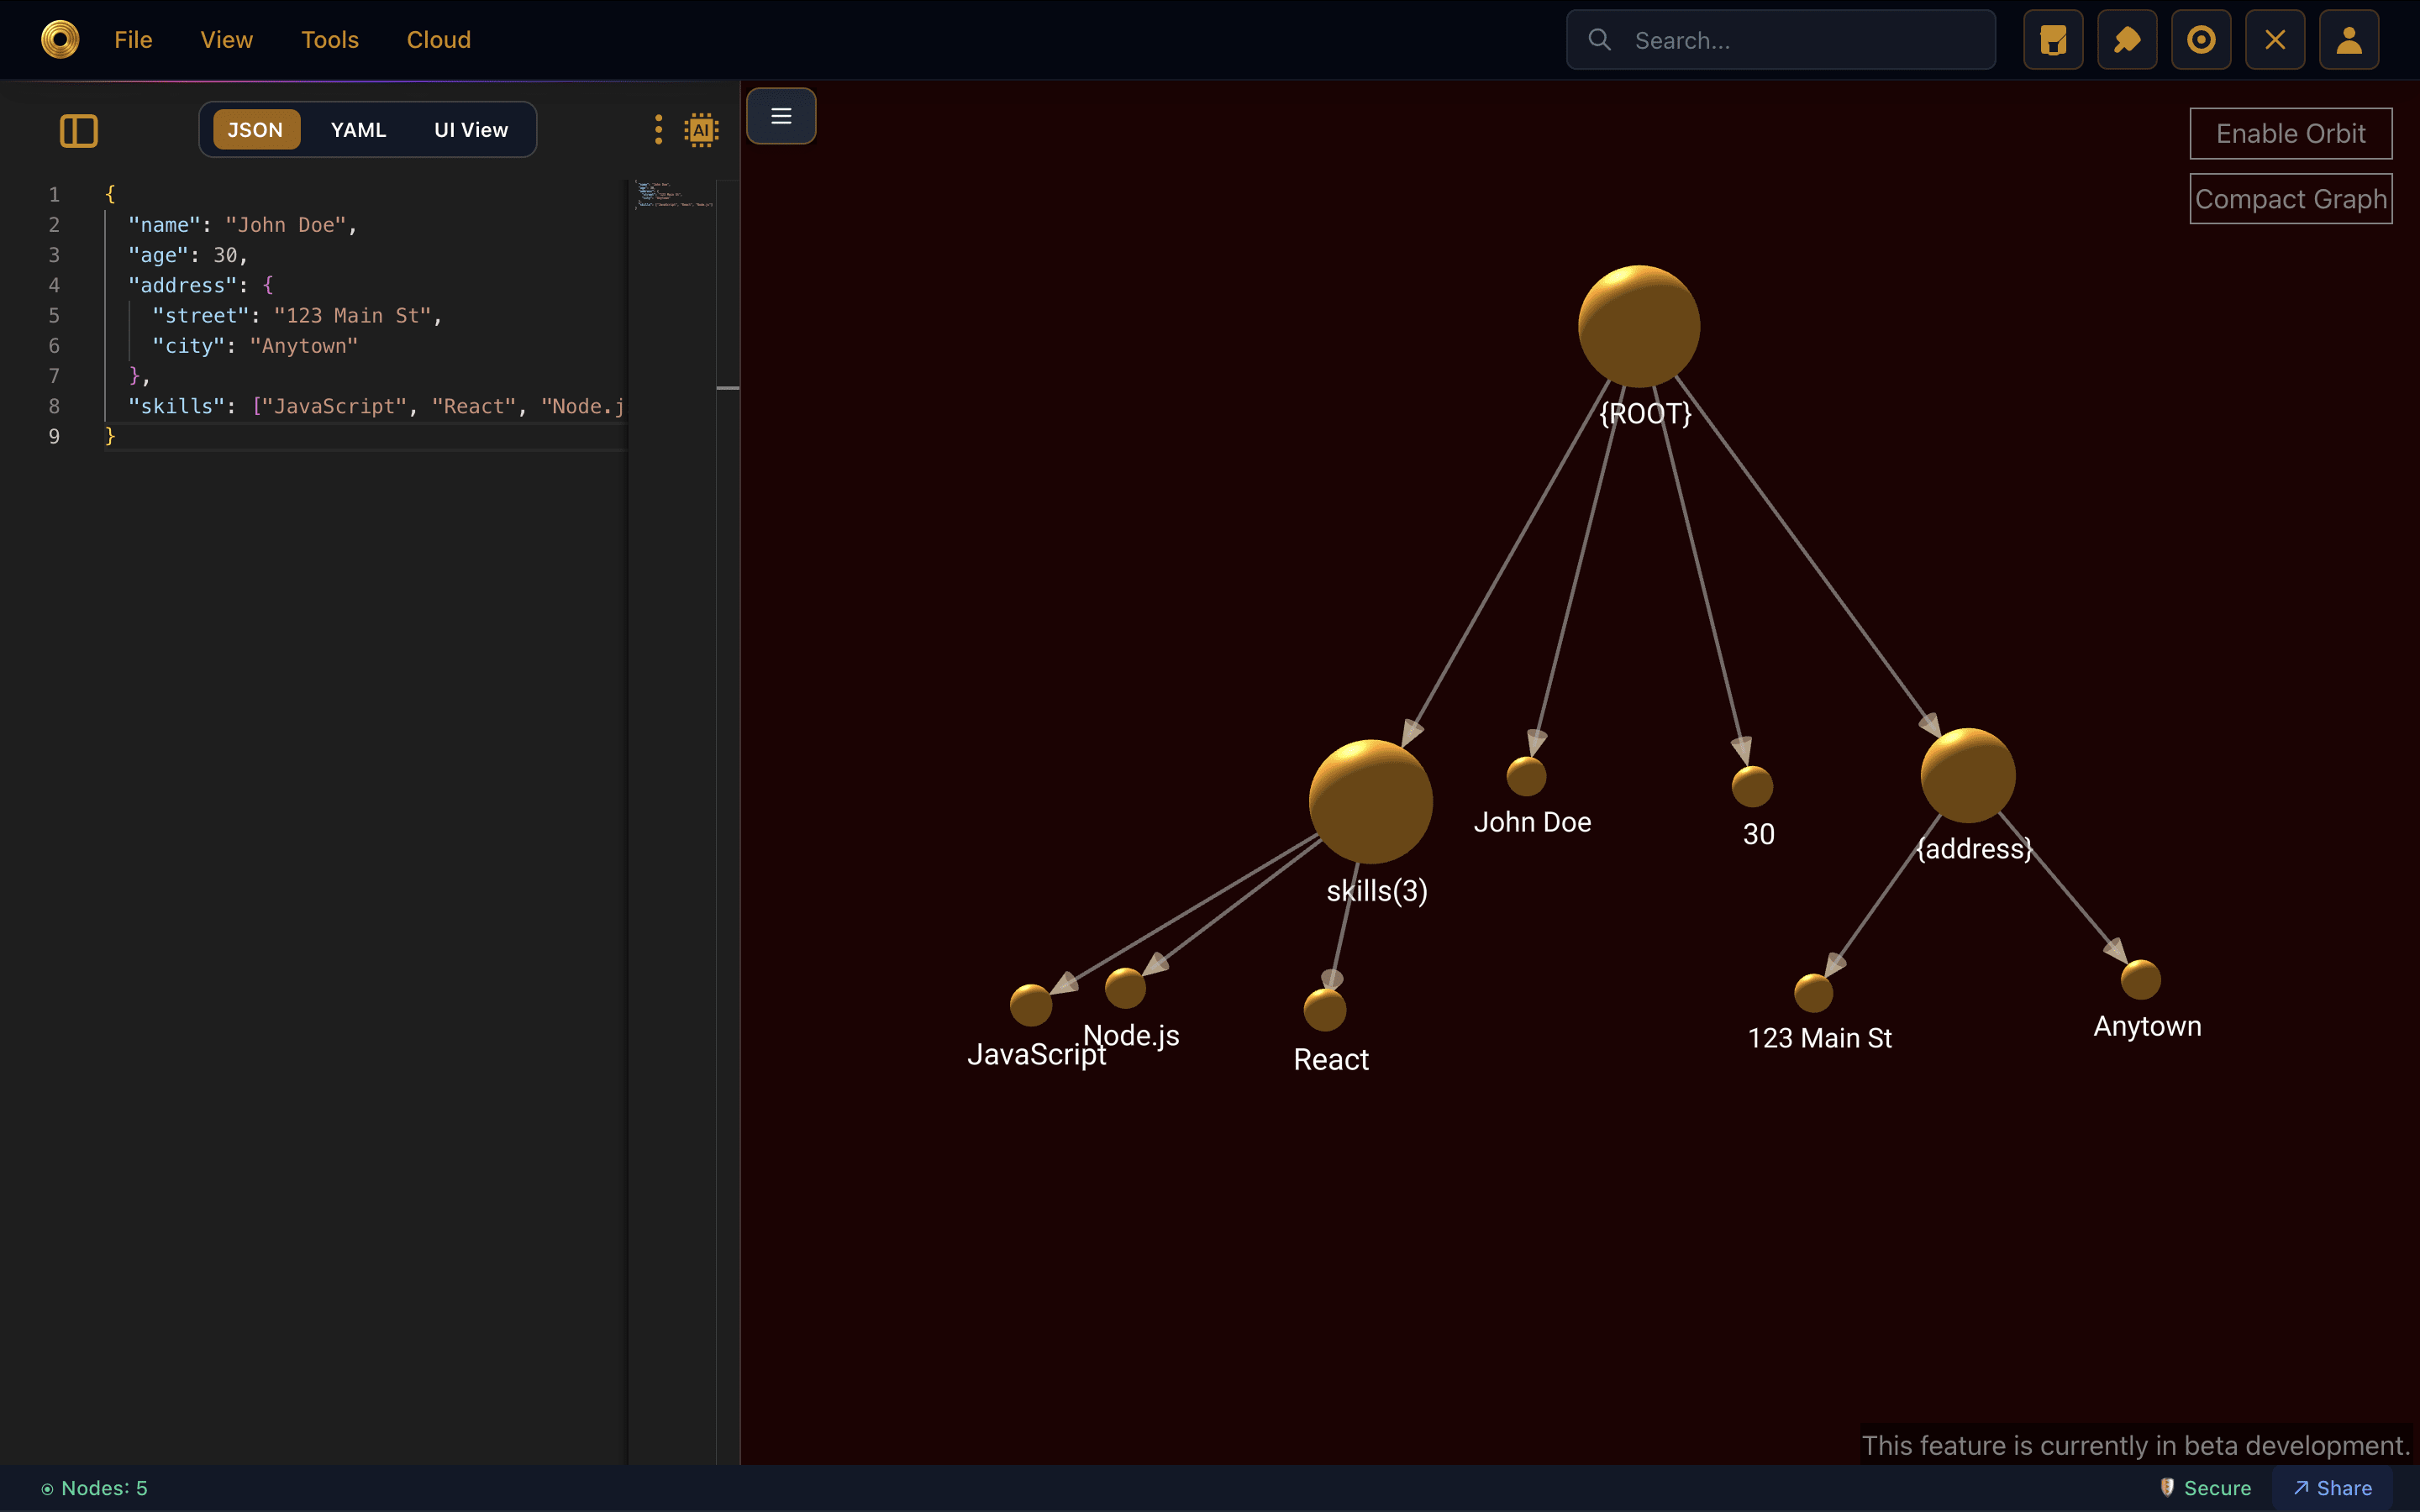
JSON 3D Visualization turns complex nested JSON into a spatial 3D graph that you can zoom, rotate, and interact with.
Imagine this:
A central node expands into children like a galaxy forming.
Hovering over elements reveals connections and data types.
Supports Graph View, Compact Diagram, and Tree View.
You rotate and explore data structures like you're flying through a digital city.
How It Works
- ✓Upload or Paste JSON,YAML
- ✓Click “3D Visualization”
- ✓💥 BOOM! A fully interactive 3D model of your data appears
Why 3D Visualization?
While traditional tree and graph views are great, they get messy fast with deeply nested or wide datasets. 3D changes the game:
Better Depth Perception
Nested structures are no longer cramped—they’re spaced out in 3D layers.
Instantly Spot Relationships
Parent-child and linked data pop with color-coded connectors and node clusters.
More Fun & Intuitive
Let’s be honest—3D is just more fun. And when learning or debugging, fun means faster understanding.
Search & Hover to Highlight Connected Nodes
- ✓Use the search bar to find any key, value, or path.
- ✓Matching nodes are auto-highlighted in 3D.
- ✓Hover over any node to light up its connected relationships (parent, children, linked nodes).
Like x-ray vision for your JSON.
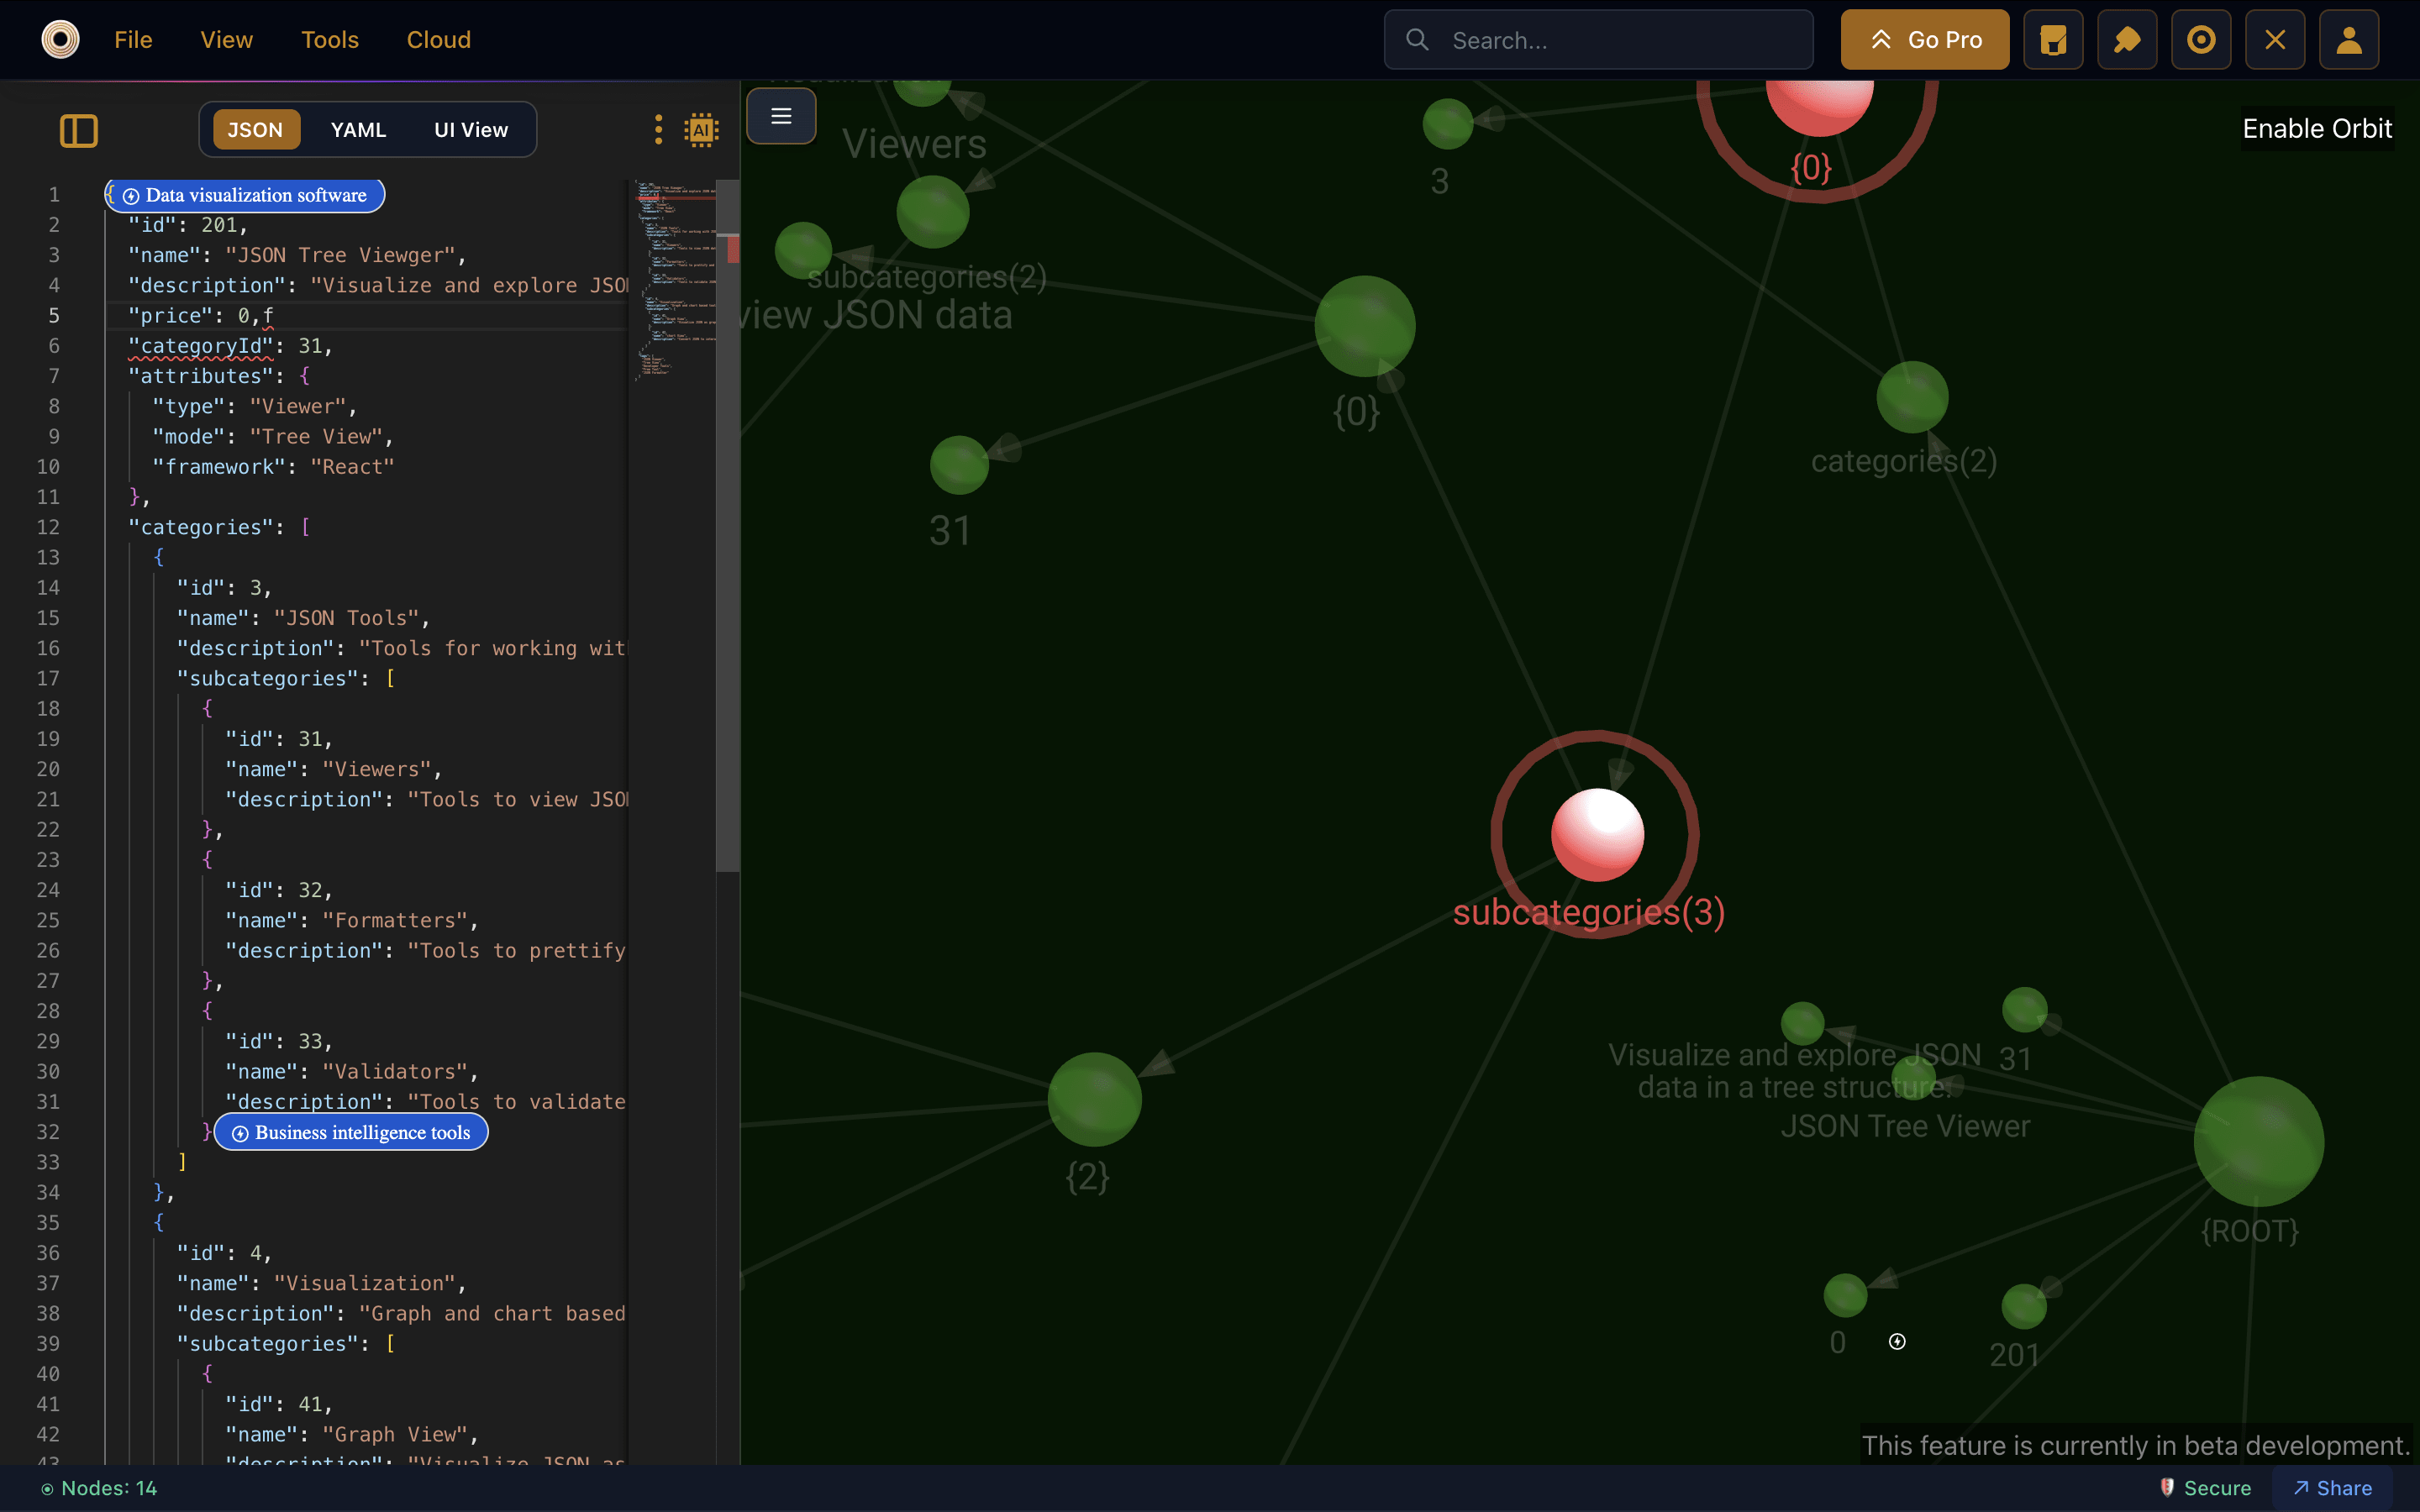
Multiple Layouts for Every Use Case
- ✓Top-to-Bottom: Great for hierarchy (like trees or schemas)
- ✓Radial Outward: Data explodes like a galaxy from the center
- ✓Circular and Force-directed layouts for flexible mapping
Switch layouts in real-time with a click.
Advanced Interaction Modes
- ✓Orbit: Spin around the dataset like a planet
- ✓Pan: Move freely across dimensions
- ✓Rotate: Twist the scene to inspect hidden structures
- ✓Zoom: Dive deep or zoom out for the big picture
With smooth gestures and intuitive mouse/touch controls, navigating 3D JSON is seamless.
Additional Features That Set Us Apart
- ✓Themes Customize
- ✓Node scaling based on depth or data size
- ✓Two type graphs
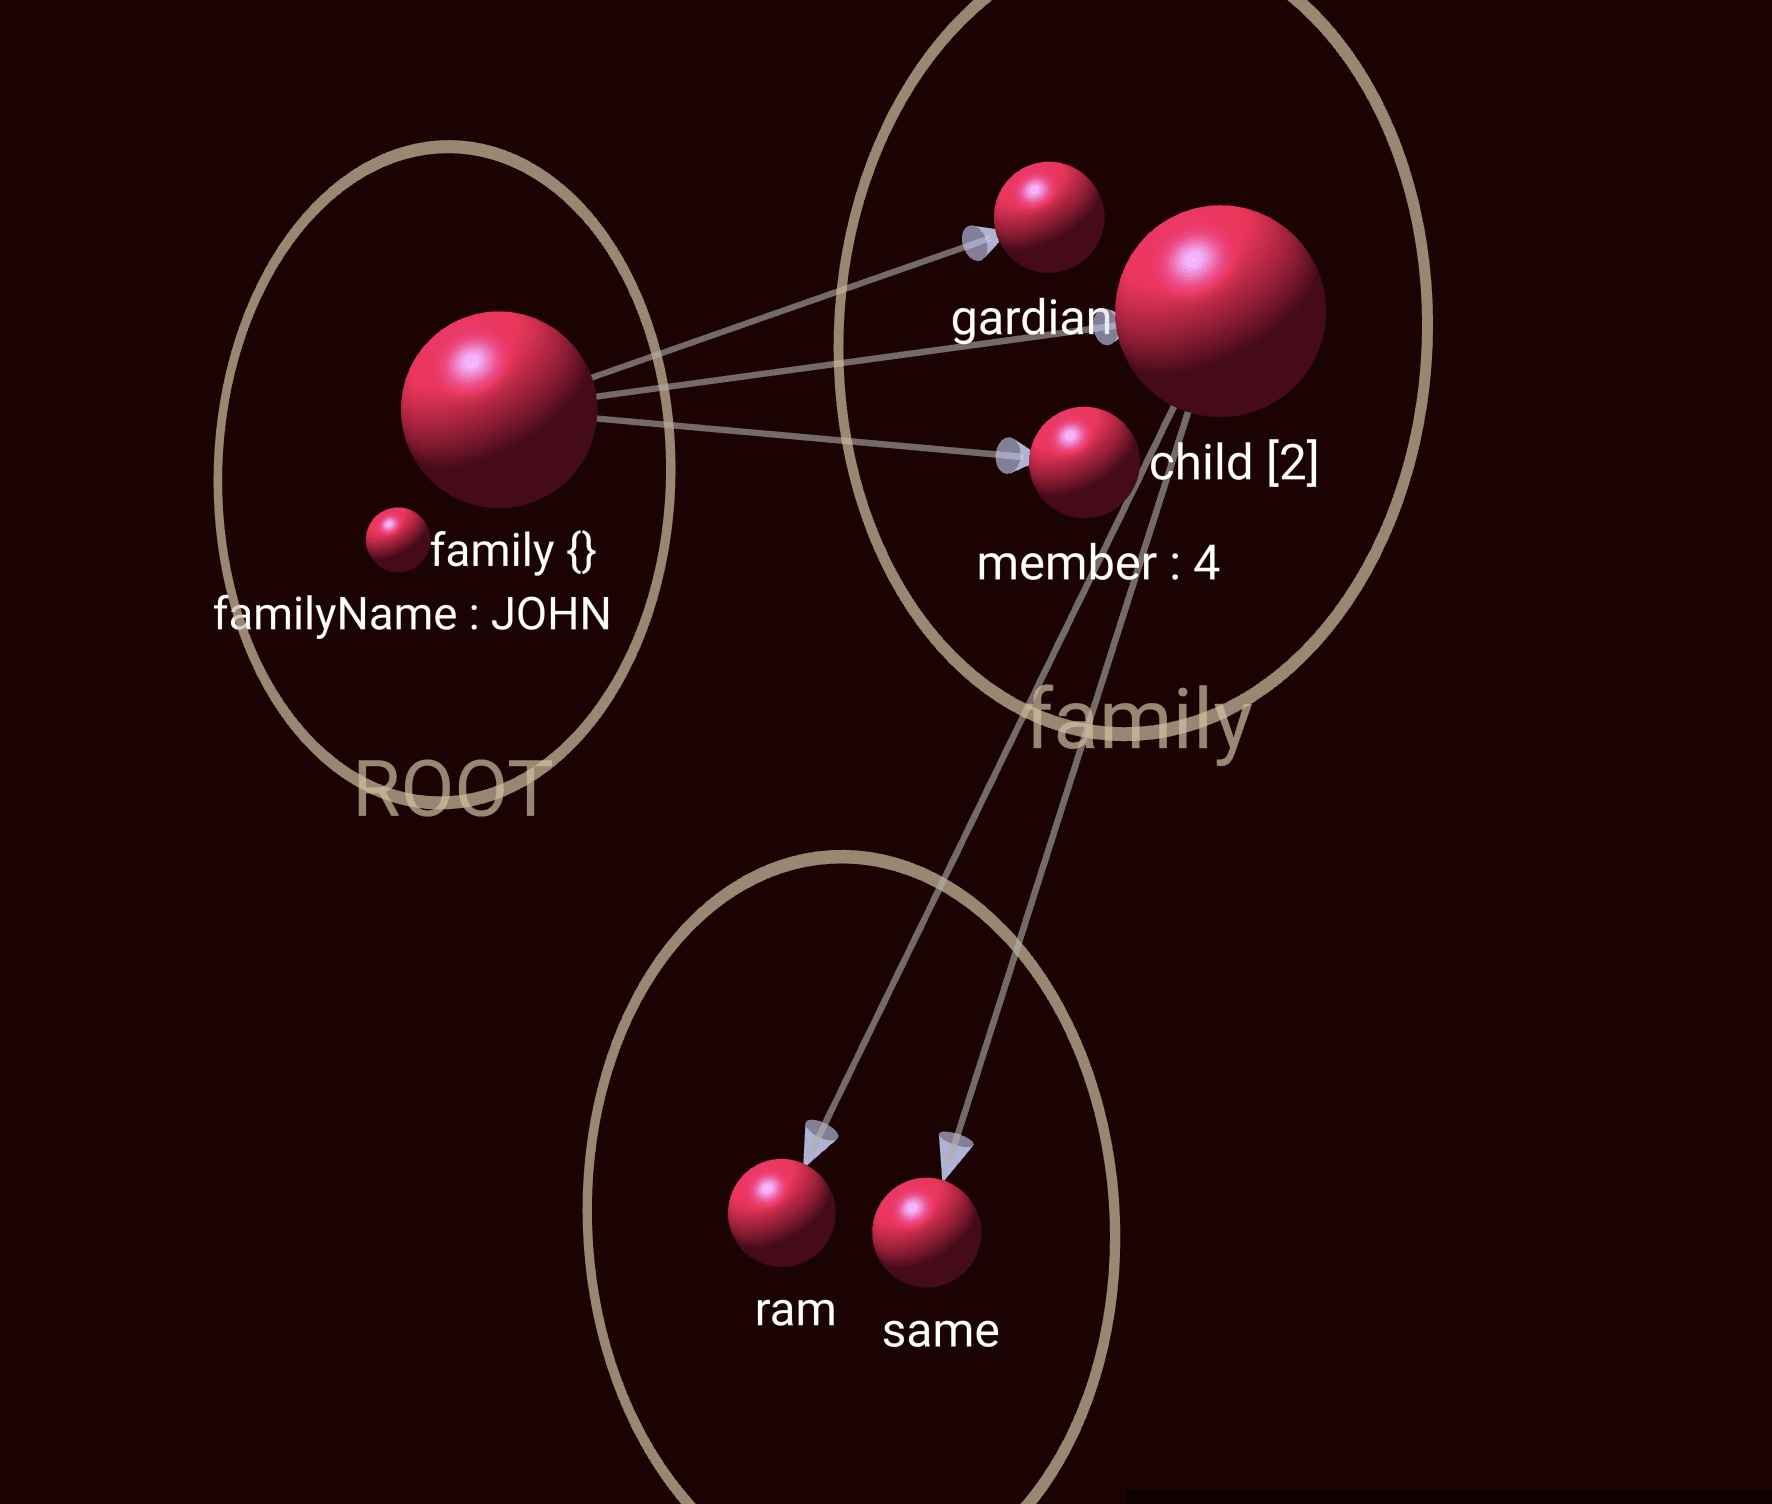
Example JSON
{
  "name": "John Doe",
  "age": 30,
  "address": {
    "street": "123 Main St",
    "city": "Anytown"
  },
  "skills": ["JavaScript", "React", "Node.js"]
}
Use Cases
- ✓Debugging complex API responses
- ✓Visualizing MongoDB or NoSQL document relationships
- ✓Educational demos for JSON beginners
- ✓Presenting JSON schemas to clients or teams
- ✓Exploring large datasets without getting lost
JSON in 3D. It's not just beautiful—it's powerful.