Online REST Client with Diagram: A Smarter Way to Visualize API Responses
APIs serve as the bridge for communication between applications, making them a core component of modern web and mobile development. However, working with REST APIs often means dealing with complex JSON responses that can be difficult to read and debug. This is where an Online REST Client with Diagram can significantly enhance the developer experience by visualizing API responses in an interactive format.
Instead of sifting through deeply nested JSON structures in raw text, developers can quickly interpret API data through automatically generated diagrams. This graphical representation of JSON responses simplifies debugging, improves API documentation, and enhances collaboration between teams.
Why Use an Online REST Client with Diagram?
Most REST clients only present API responses in raw JSON or tabular formats. While helpful, these formats can be overwhelming, especially for large and deeply nested responses. A visual representation simplifies data comprehension.
🔍 Key Benefits
Better Data Understanding
Intuitive API exploration with visual hierarchy representation makes complex data structures instantly clear.
Faster Debugging
Spot errors and inconsistencies quickly without manually parsing through lines of JSON text.
Improved API Documentation
Share structured diagrams that clearly illustrate endpoint responses for better understanding.
Enhanced Collaboration
Help team members and stakeholders understand API responses with visual representations.
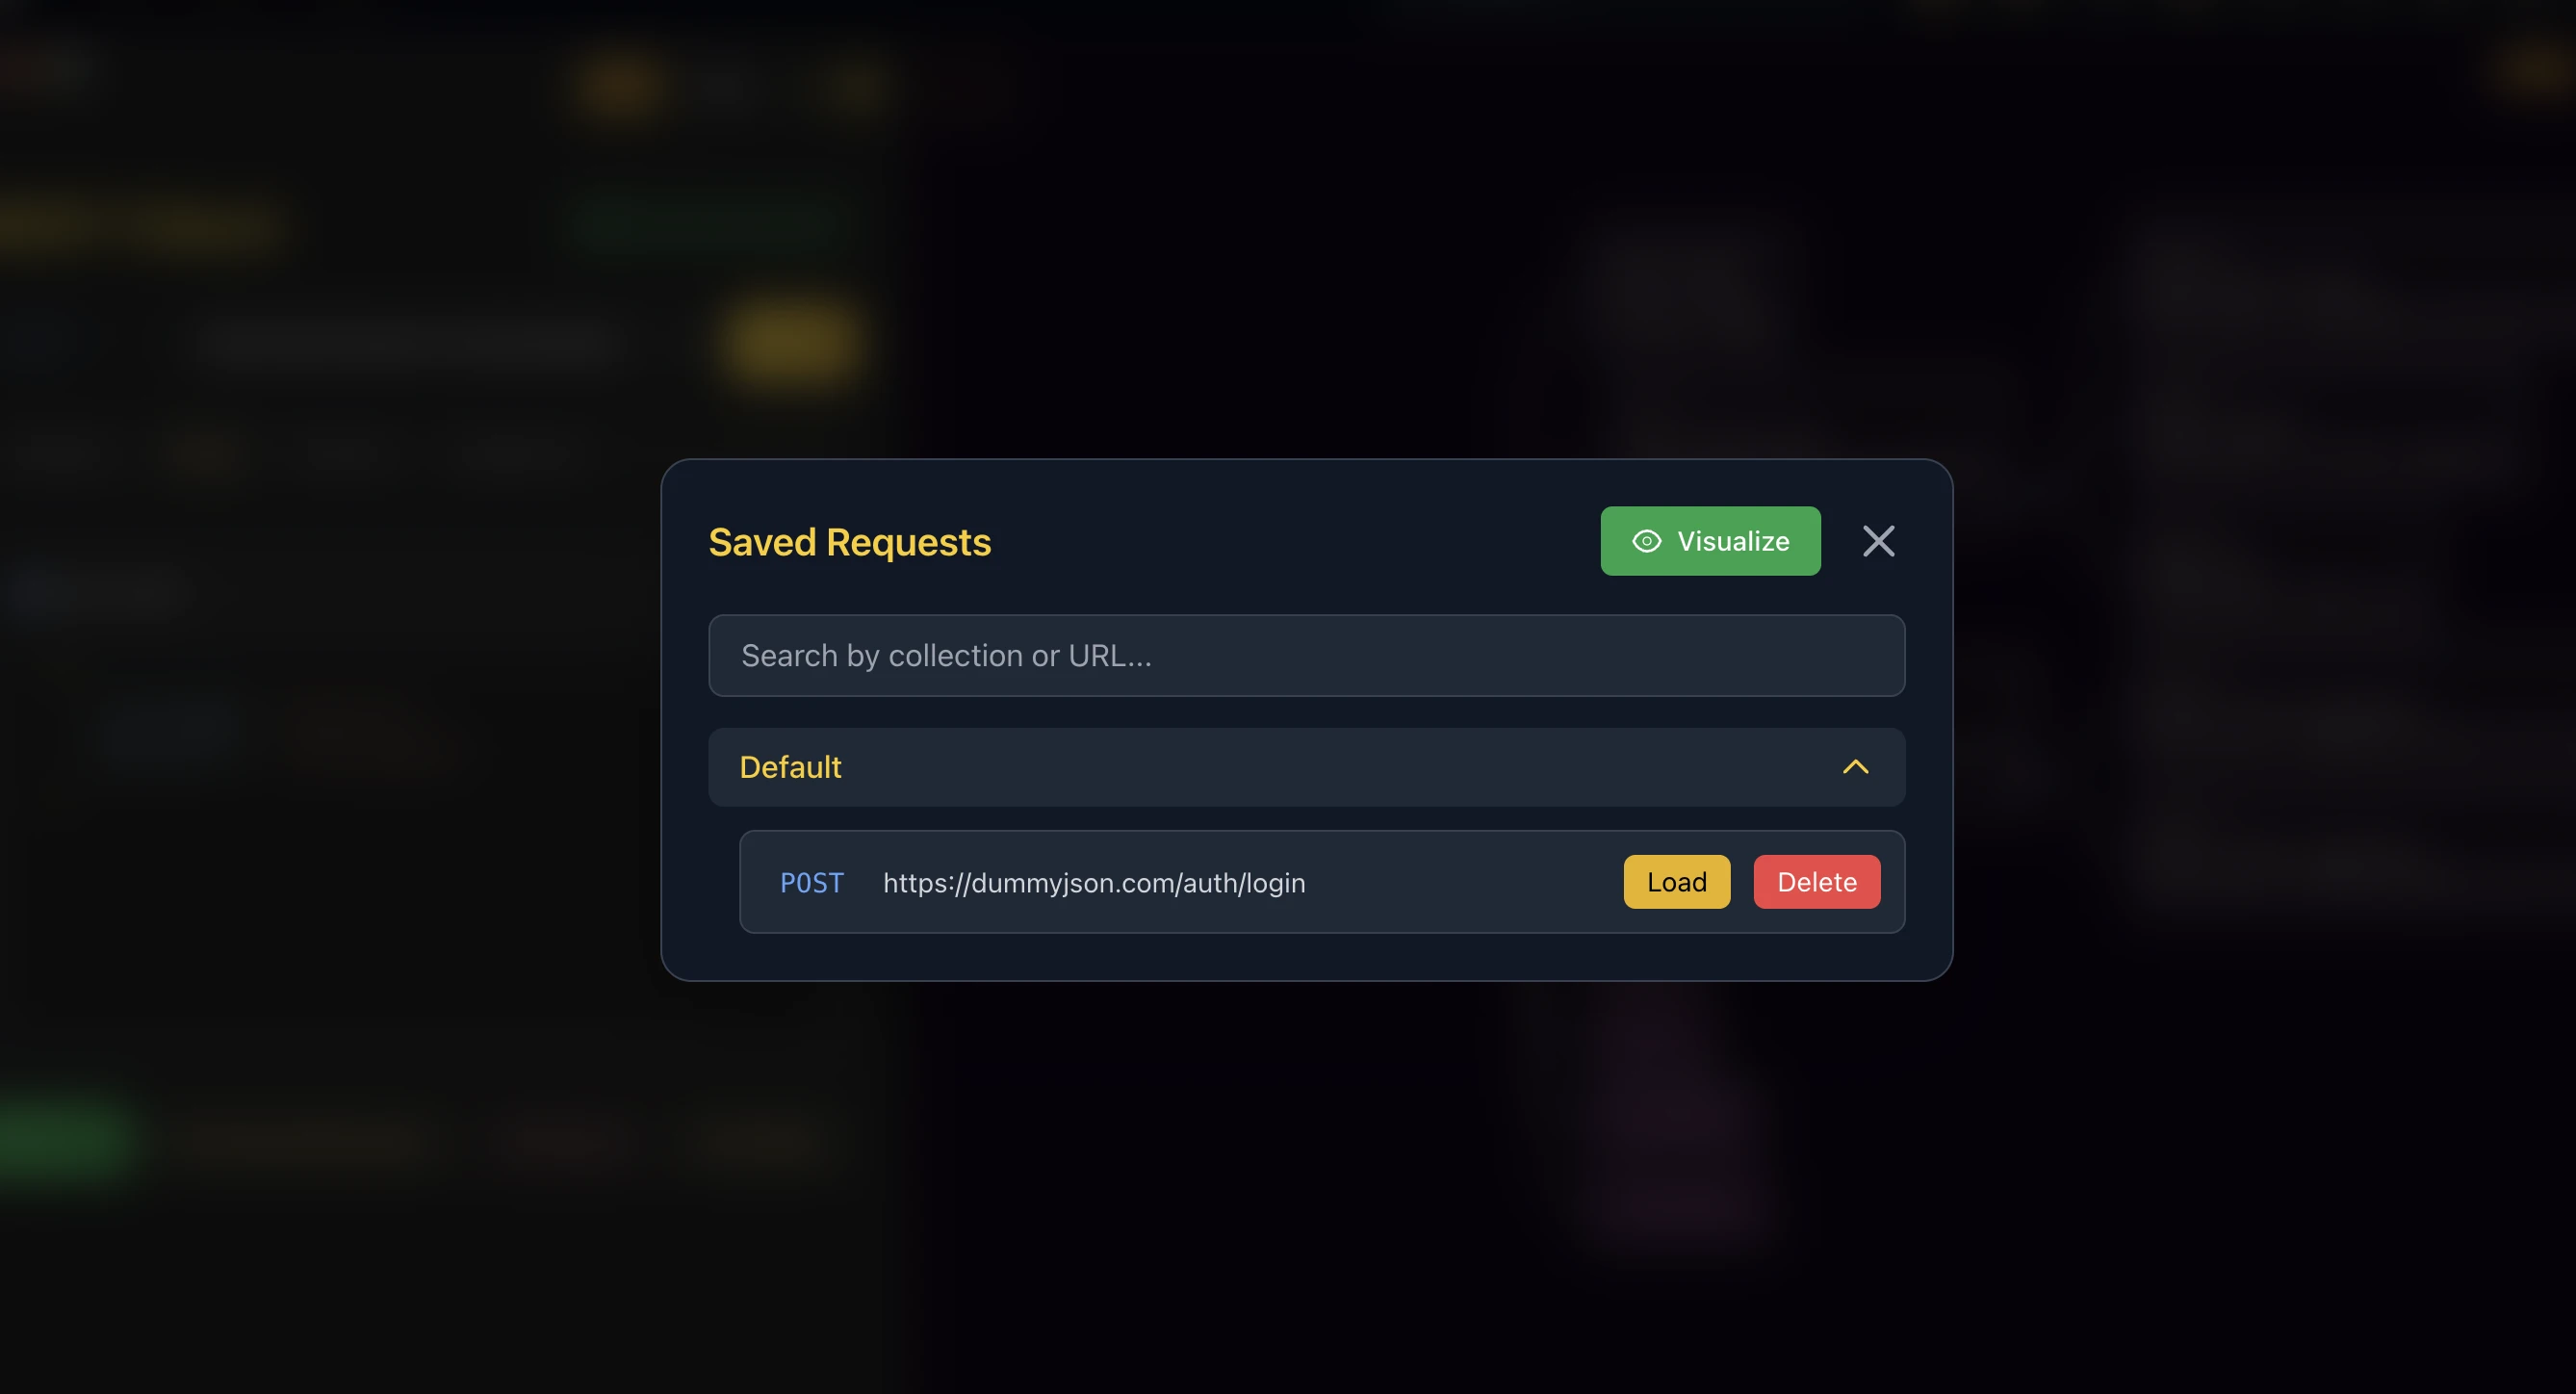
Save & Revisit API Requests
Our REST Client allows you to save API requests for future use. No need to manually enter URLs, headers, or parameters every time.
- ✓Saved requests visualize into interactive diagrams
- ✓Organize saved requests into collections
- ✓Edit and re-execute saved requests anytime
- ✓Bookmark frequently used API calls
Key Features
🛠 Real-Time API Requests
Send GET, POST, PUT, DELETE requests effortlessly with support for authentication and custom headers.
📊 Instant JSON Visualization
Converts complex API responses into beautiful interactive diagrams for better comprehension.
💾 Save & Revisit API Requests
Save frequently used API requests and revisit them anytime with our cloud storage solution.
📥 Export & Share API Visualizations
Download diagrams as PNG, SVG, or JSON files and share them with your team members or clients.
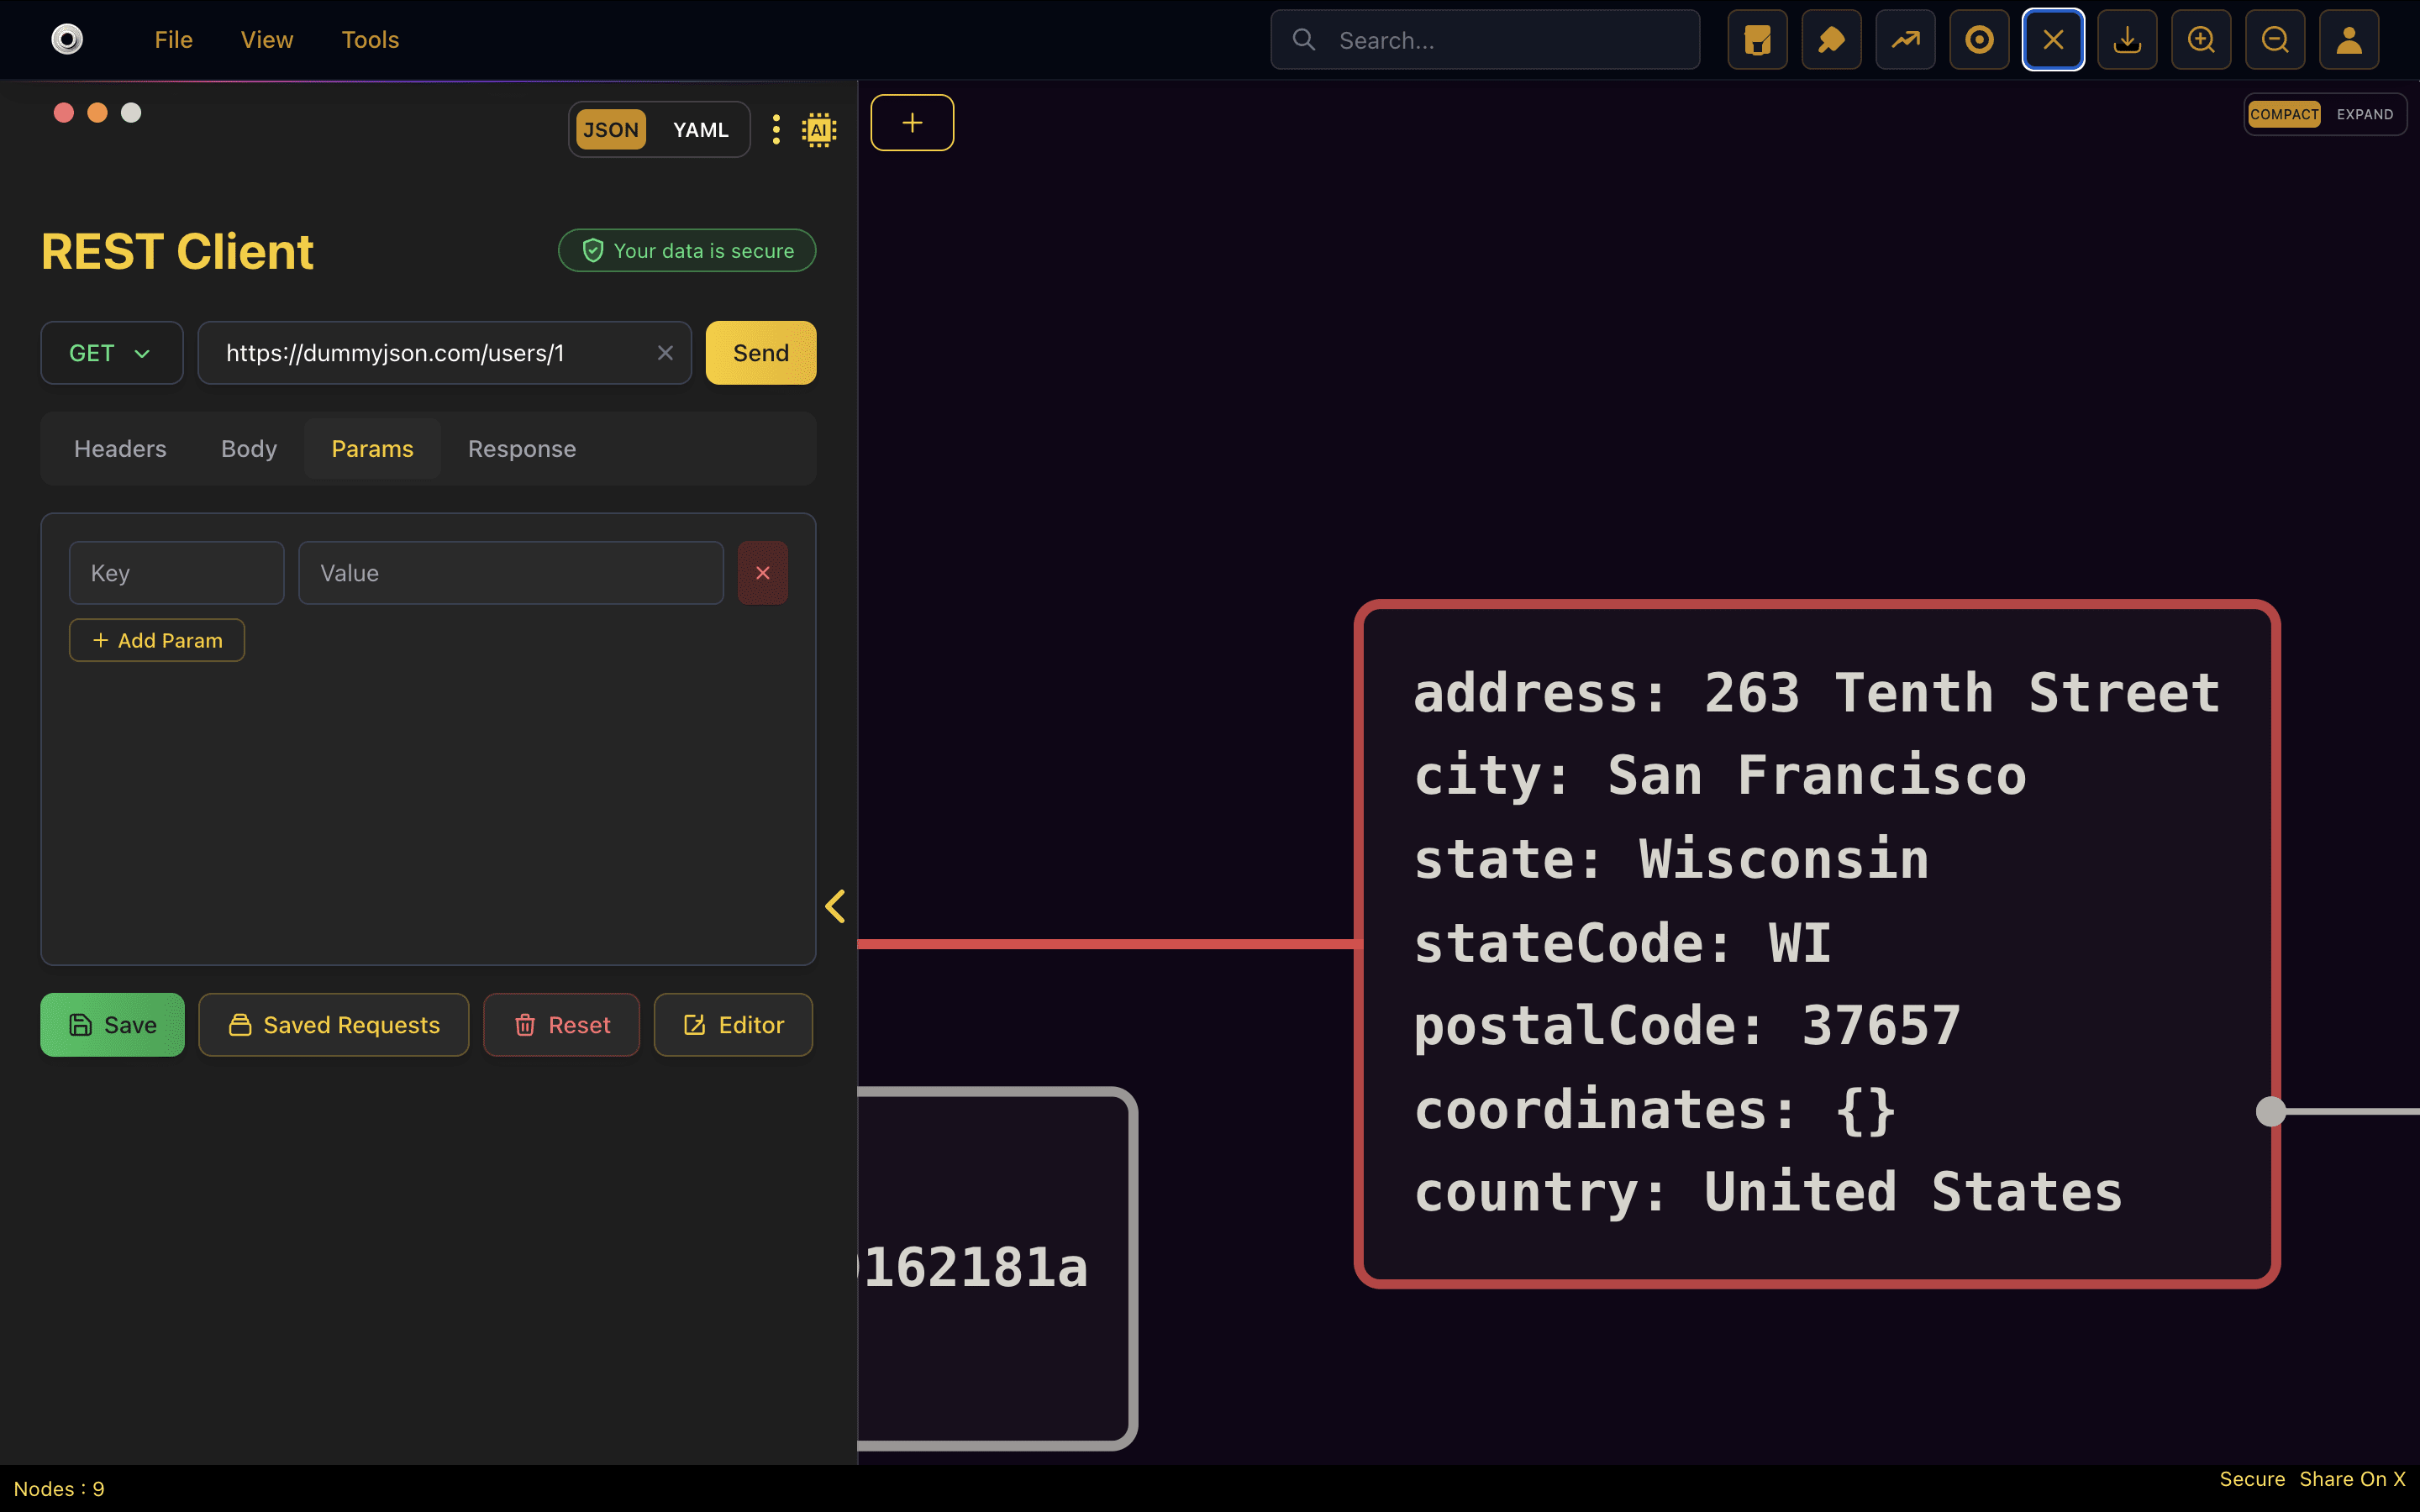
How It Works
Enter API URL & set headers/params
Configure your request with our intuitive interface for headers, authentication, and parameters.
Send request to fetch API response
Execute your request with a single click and get real-time response data.
View JSON response as a diagram
Instantly see your response transformed into an interactive visual diagram.
Export or share visualization
Save your diagrams in various formats or share them directly with your team.
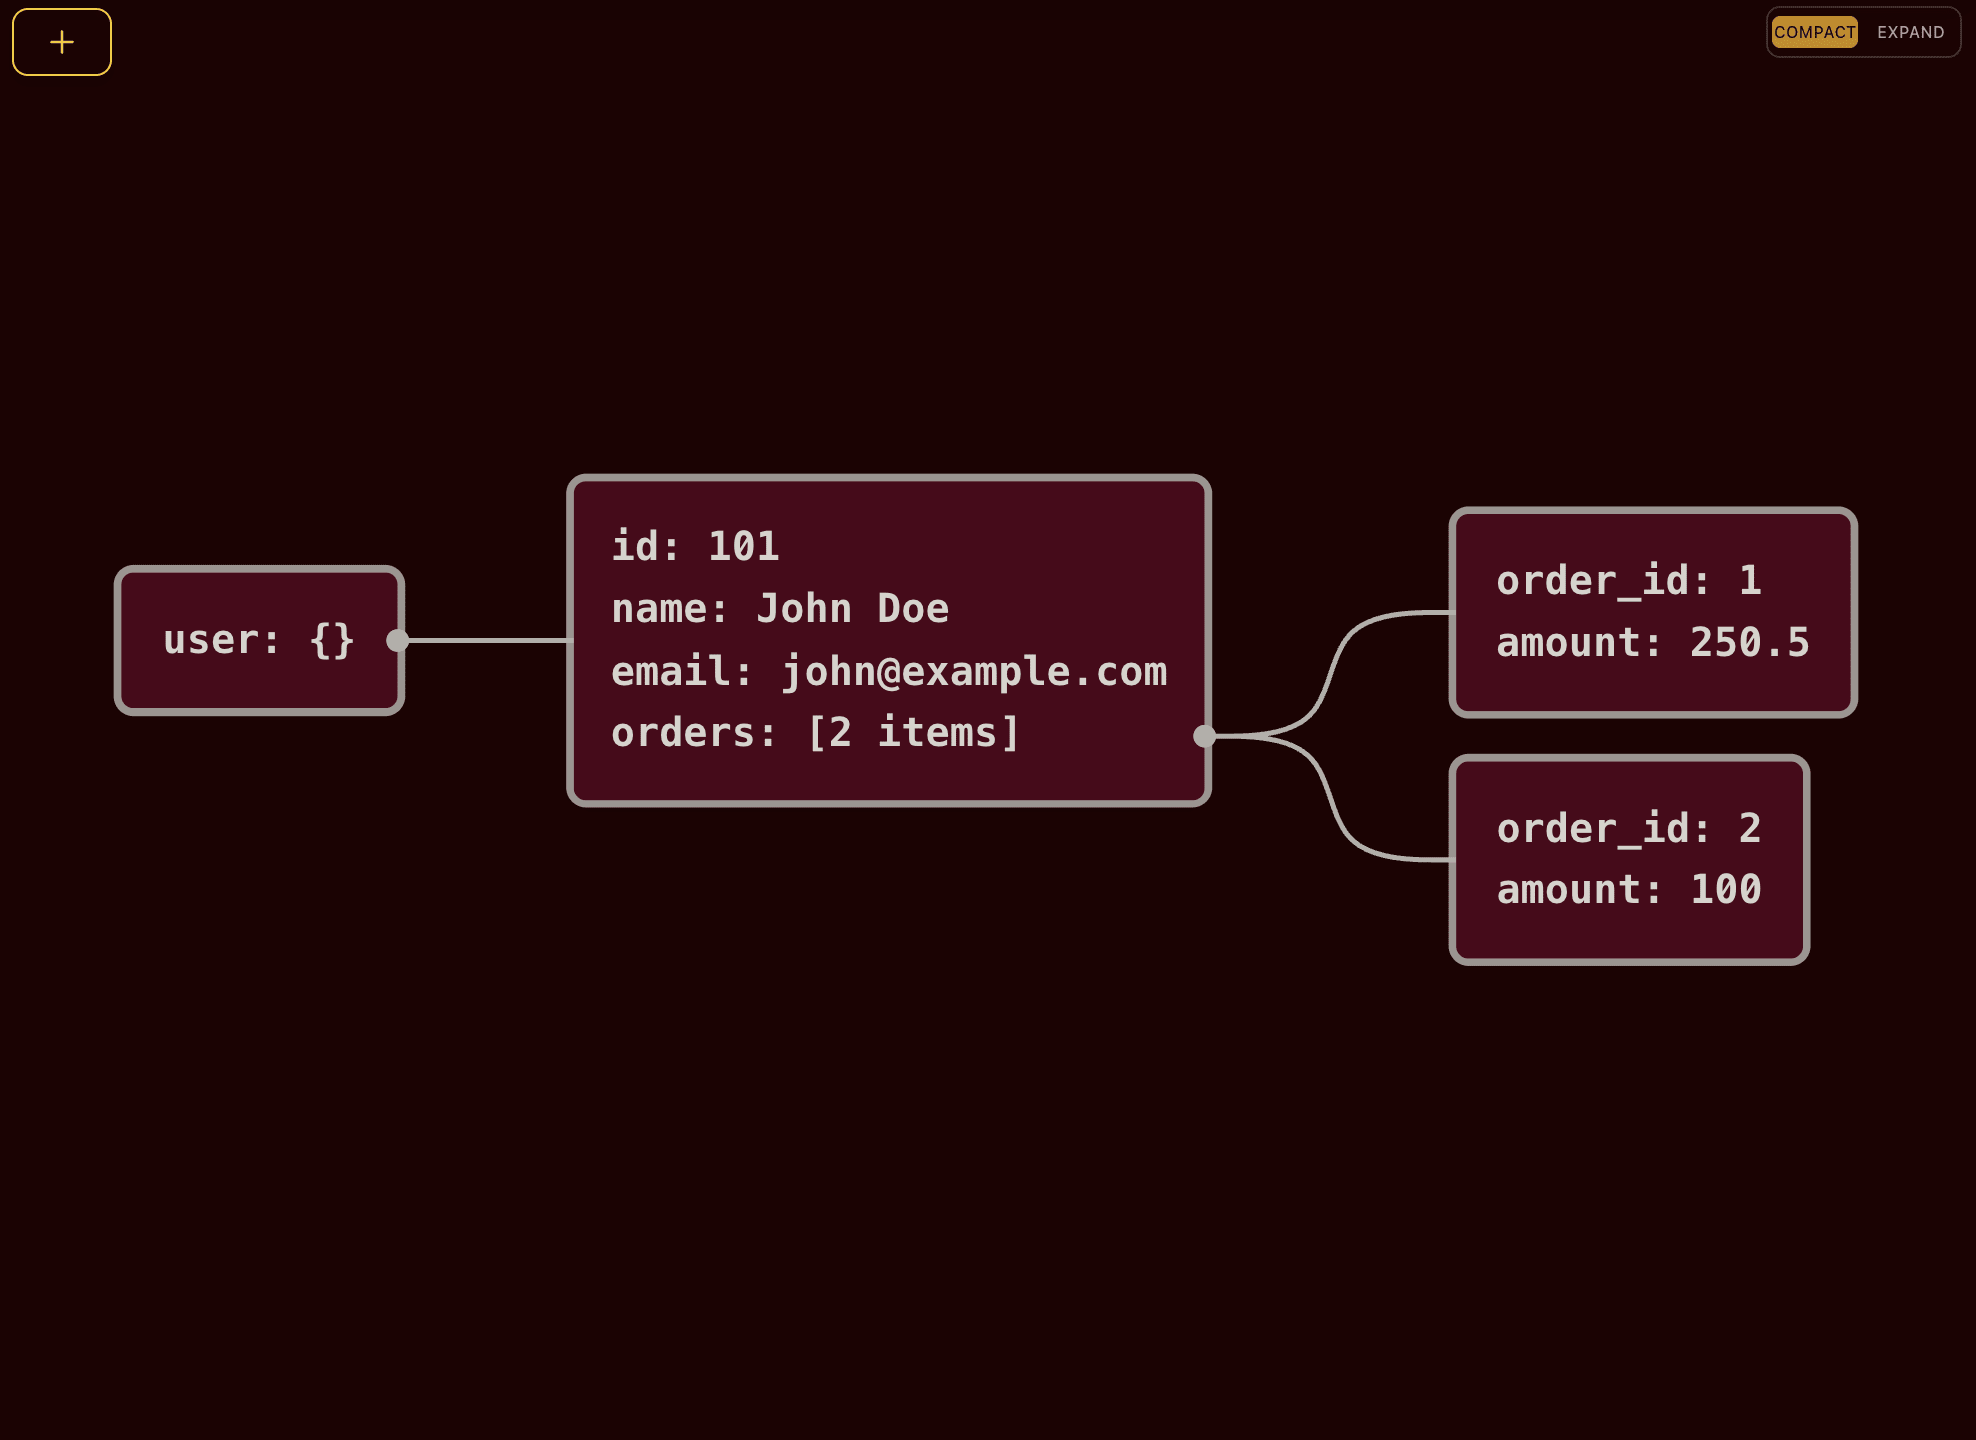
Example: Visualizing an API Response
Consider a REST API returning this JSON response:
{
  "user": {
    "id": 101,
    "name": "John Doe",
    "email": "john@example.com",
    "orders": [
      { "order_id": 1, "amount": 250.50 },
      { "order_id": 2, "amount": 100.00 }
    ]
  }
}
Which transforms into this visualization:
🚀 Try our Online REST Client with Diagram today!
Simplify your API testing and debugging workflow with our powerful visualization tool.