How to Visualize JSON as a Diagram
Seeing JSON data as diagrams is a very useful tool to understand how complex datasets are working. As a developer or an API owner it becomes a lot easier if you can visualize based on tree or graph structure to represent JSON data. Below is the step-by-step process how you can do visual representation of your json.
1. Understand the JSON Structure
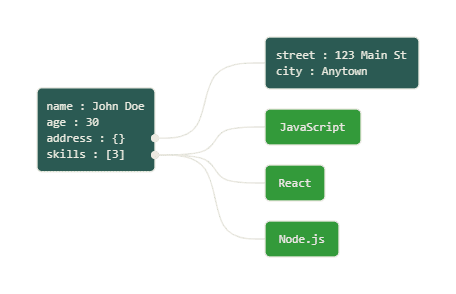
JSON is structured as key-value pairs, where keys are the labels and values can be data types like strings, numbers, arrays, or even nested objects. Understanding the basic structure of JSON is the first step to visualizing it.
{
  "name": "John Doe",
  "age": 30,
  "address": {
    "street": "123 Main St",
    "city": "Anytown"
  },
  "skills": ["JavaScript", "React", "Node.js"]
}
2. Compare JSON Graphically
If you need to compare two JSON datasets, often doing this visually allows us to very quickly discover subtle differences and similarities that might require lots of time for the text-based human language. In this tool you can upload multiple JSON files and it will compare these files, differ them in a graphical form.

3. Search JSON Graphically
Searching through large JSON datasets can be overwhelming, but with our graphical search feature, you can easily locate specific keys or values in the diagram. The search results will be highlighted within the graph, making it easier to navigate and understand the data.
.png?updatedAt=1729877769570)
4. Use Tools for Visualization
There are various online tools that allow you to input JSON data and output a visual diagram. Our free JSON viewer tool supports both tree and graph visualizations, making it easy to explore your data interactively.
Our tool also offers two types of graph visualizations:
- Compact Graph: A simplified version, ideal for a concise view of the data with minimal details.
- Expanded Graph: A detailed visualization that fully displays all keys, values, and relationships within the JSON structure.
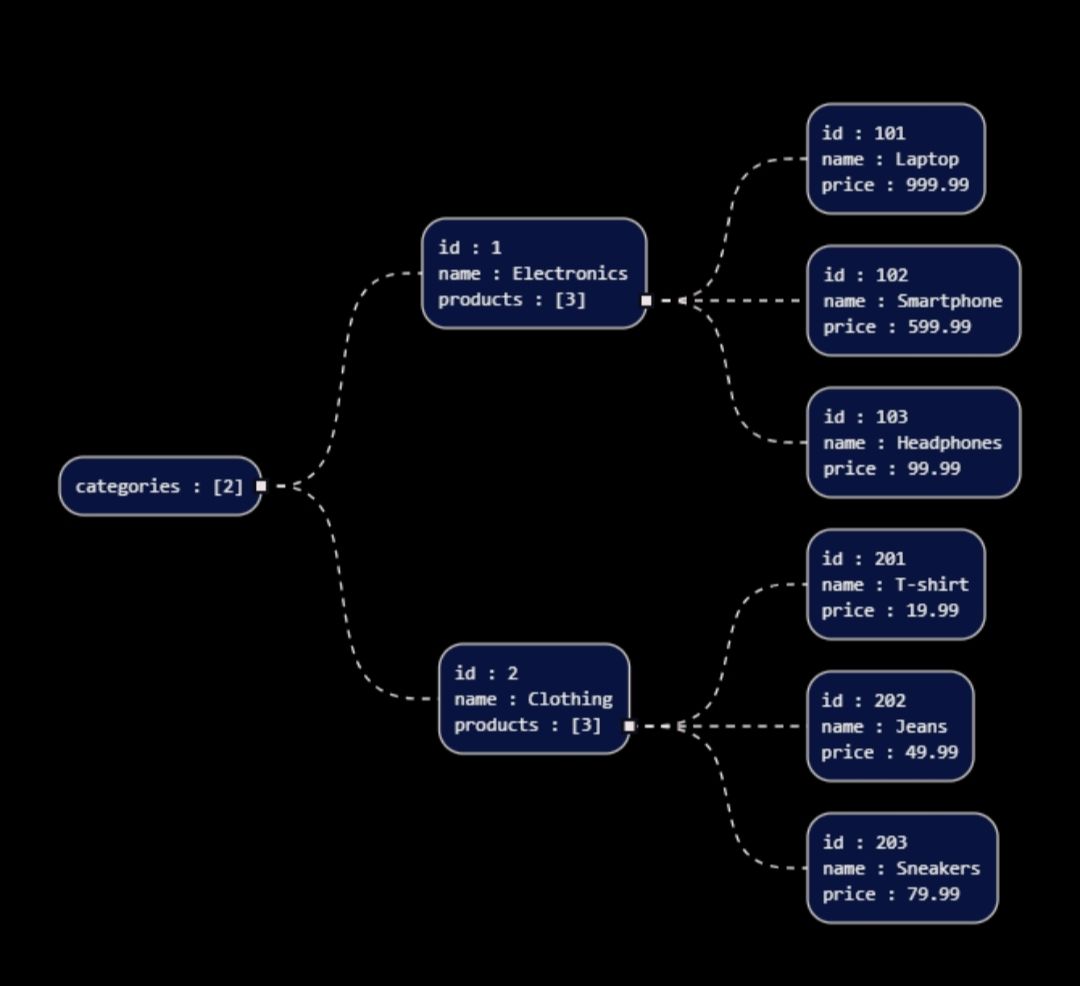
5. Visualize with Key Relationships
As soon as you load your JSON in the viewer, the tool automatically interprets the data into a graphical representation where objects, arrays and values are distinguished highlighting key links. Filter by specific nodes, rearrange the node links and export for your own uses
6. Customize Your View
Most tools allow customization of how the JSON is represented visually. You can adjust node shape, colors, and the layout of the diagram to better suit your needs. Switching between compact and expanded views can also help you focus on the right level of detail for your task.

7. Export and Share
Finally, once you're satisfied with the visual representation, many tools (including ours) offer the ability to export the diagram as an image or other formats. This makes it easy to share your data visualization with others or use it in documentation.

Using diagrams to visualize JSON makes it easier to analyze and understand the structure of your data, offering clarity in ways that reading raw JSON might not. Try visualizing your own data today using our free JSON viewer tool and see the difference it makes!